Why Are QA Metrics Important?
QA testing metrics become decision points a Team Lead can use to estimate a team’s productivity over time and plan their work in the future. For instance, recording a number of tests added to a new release helps you estimate the time required for regression. Meanwhile, the number of bugs detected gives a clue to how much the team is going to need to retest after developers fix the defects. And these are the simplest examples. In the long run, a team can derive many more advantages.
- QA metrics help Team Leads to estimate the effectiveness of their approach and testing methods. Therefore, the team will be better prepared for each upcoming release cycle.
- Metrics provide insights into typical software behavior. Hence, QA engineers can learn patterns and domain bugs that occur in similar products.
- Moreover, metrics help product owners and project managers get a better understanding of how quality assurance works and to what extent they are succeeding.
Keep in mind that metrics out of context are just numbers. You need to consider the specifications of a project, expected delivery, company’s processes, etc. to estimate a team’s performance correctly.
What Questions Do QA Metrics Answer?
Speaking about the role of QA metrics in agile, they are as important as in traditional software development models. Metrics don’t exist for the sake of reports – they answer essential questions, in particular:
- How much time will testing of a product take?
- How many bugs have been fixed/closed/reopened?
- What is the level of severity of those bugs?
- How much time will retest take?
- How many new features have been added?
- Does the regression test suite need modifications now?
- How many defects were reported by users?
- What areas did QA engineers miss? What should they focus on?
- Can we finish testing in time?
- How efficient are the test cases?
By analyzing the answers, you can detect the product and process-related issues that slow down the delivery. As a result, you can learn what areas require improvements and find a way to organize the processes in a better way.

What Problems Can Metrics Reveal?
In addition to tracking a team’s performance, QA metrics shed light on some weak spots in the process or cross-team communication. They often help to reveal some of the following issues:
- the lack of communication between development and QA teams;
- the lack of product/domain knowledge and/or details regarding reported defects;
- frequent changes in product requirements or hardware/software configurations;
- instability of the system under test;
- ineffective planning, task assignment, or deadline estimation;
- obsolescence of software module/feature or test cases applied.
Examples of QA Metrics
There are two types of metrics – absolute and derivative. Both can evaluate a testing process or quality of a product tested. Now, let’s learn more about how to gather or calculate different metrics and where to apply them.
Absolute, or Base Metrics
Data featured in these metrics are gathered during test case development & execution and tracked through the STLC. Base metrics are related to the test execution status at a particular stage or as for the end of the testing procedures. Some prefer to refer to this data as measurements, as it features information about values you can count:
- total number of test cases written/executed;
- number of test cases passed/failed/blocked/pending;
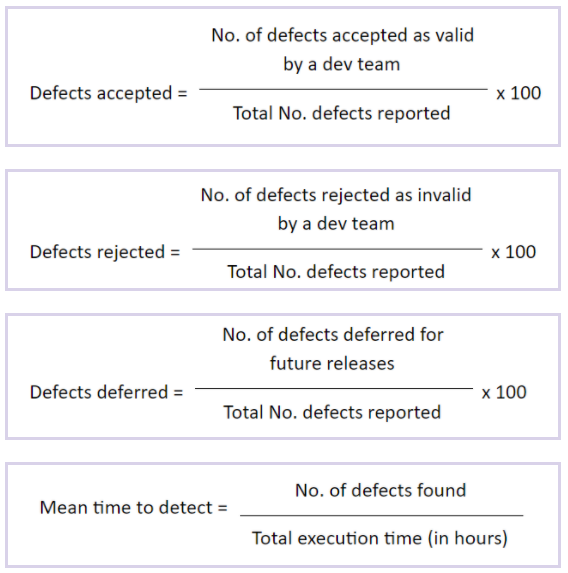
- defects found/accepted/rejected/deferred;
- critical/high/medium/low defects;
- planned & actual test hours;
- defects found during retesting/regression.
Derivative, or Calculated Metrics
Derivative metrics are calculated by applying specific formulas to absolute metrics. This data is valuable for Team Leads, Test Managers, and stakeholders. Below are several widely used categories of metrics with formulas that can be helpful in testing process management.
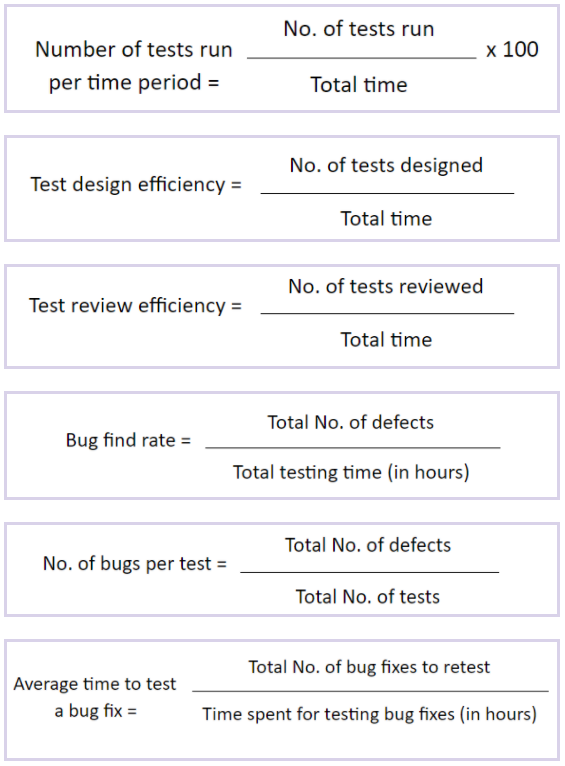
Test tracking metrics
The percentage of passed/failed/blocked tests, etc. is a way to estimate the status of testing and the amount of work done or left to do. It also helps to detect the areas that currently need increased attention.

Test effort
This set of metrics shows the number of tests designed/run/reviewed, estimates the timing and efficiency of testing procedures. It is meant to answer the “how” questions. For example: how much can we test and how long will it take? The data we receive becomes the basis for future planning.
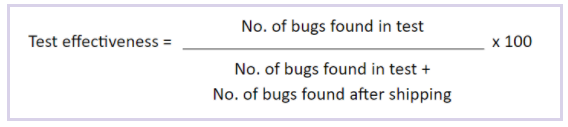
Test effectiveness
The effectiveness encompases metrics-based or context-based calculations that allow you to estimate the value of a used test set. Remember that the effectiveness cannot be 100%. Still, always review the tests to aim for a higher value.
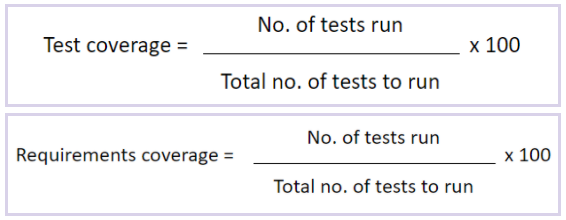
Test coverage
The coverage shows how much of the application has been tested or how many requirements have been already checked. For instance, a number of requirements covered, test cases by requirements, and requirements without coverage belong here.
Test team metrics
These metrics feature test cases allocated/executed per team member, distribution of defects returned, defects for retest per team member, etc. This data helps to understand the workload allocated for every team member and learn whether some need clarification or, on the contrary, can take on extra tasks.
Defect-related metrics
Last but not least, there are defect-related metrics, which demonstrate gap analysis & removal efficiency, density, age, etc. Similarly to absolute metrics, they allow you to get a better understanding of the system as a whole while also estimating team efficiency.
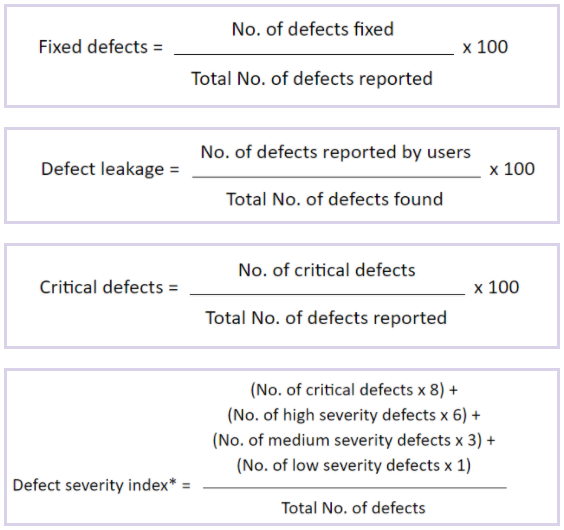
*To calculate the defect severity index, QA specialists assign a coefficient to each severity level:
- Critical bugs – 8.
- High-severity bugs – 6.
- Medium-severity bugs – 3.
- Low-severity bugs – 1.
As a rule, the defect severity index reduces as the testing cycle progresses and reaches the minimal value before the release. Comparing these numbers throughout the testing process helps to evaluate the effectiveness of the team’s strategy and work in general. If the severity index remains high as the testing progresses, there are some issues to address.
KPI for QA Team
To estimate the work of a QA team, a product owner can check if the functionality matches requirements, whether the team meets deadlines, and if they can guarantee no critical bugs on production. To get more specific reports, product owners and Team Managers use specific KPI for software testing teams. Here’s a list of KPIs/metrics you can apply to make decisions about team performance and improve the working process.
- The total number of texts executed doesn’t always have a direct correlation with the effectiveness. Still, it is useful to pay attention to how many tests (both manual and automated) a team executes within a given time frame or during a specific project.
- A defect summary reveals a number of defects reported by a QA team over a set period and the nature of those defects.
- Defect removal efficiency demonstrates how adequately the team identifies software flaws.
- A number of covered requirements is more illustrative when it comes to efficiency since it shows whether the testing strategy encompasses a product completely.
- Quantity of of new, closed, and reopened defects varies depending on project complexity. Thus, consider the time spent on detecting those issues and the frequency of reopening the defects.
- A number of critical defects clearly shows the value of testing. By looking at the list of severe bugs, you can understand the potential losses in case you decided not to run the testing.
- Automation coverage helps to monitor the relevance of the automation test suite. As a result, the team can come up with a better strategy for pending test cases.
- Finally, automation velocity estimates the pace of automation over a chosen period by measuring a number of test cases, new scripts delivery, and resource allocation.
Bottom Line: Our Favorite Metrics
So, as you already know, the tracking of QA metrics should have a specific goal and focus on the key areas you want to monitor and improve. A list of software quality assurance metrics varies from team to team, for businesses have very different goals and priorities. Some metrics are only used inside a software testing company (or department), while some become the indicators for clients, assuring that you take good care of their product.
Over the years, we’ve built effective in-house processes and reduced a list of necessary metrics to a minimum. It is often enough to look up into test case management software showing the percentage of tests run during a project to keep track of the progress. Also, our clients provide valuable feedback on the team’s work, so for now, we don’t have to establish other specific markers to analyze the performance of our QA engineers.